Zeek - File Extraction Plus
背景
最近在研究如何将Wazuh与YARA整合,也就是当触发Wazuh FIM事件时通过使用Wazuh主动响应模块自动执行YARA扫描。该功能将扫描集中在新文件或最近修改过的文件上,从而优化了被监控端点的资源消耗。由于我司的业务特性,最先想到的场景就是WebShell的检测了。
下面来说说在实际环境中带来的“挑战”吧。该功能主要是依托Wazuh FIM事件,如果大家熟悉Wazuh的话都应该知道,触发FIM事件的必要条件是指定监控目录。那么,当你拿着从CMDB筛选出的Web服务器给到运维询问Web路径时,你很可能无法得到你想要的答案。对于这种路径不统一的情况,你可以选择自己人工手动收集并维护,如果面对上千台的服务器,那会花费大量的时间成本,或者你可以选择将问题上升推进整改(这条“路”不好走啊😂)。
办法总比困难多
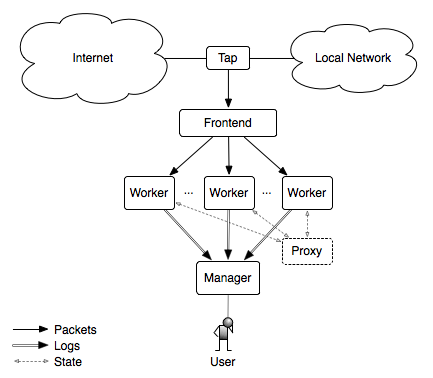
都说上帝为你关了一扇门,必定会为你打开一扇窗。某天在写代码时看到Twitter推了一条Zeek的动态,此时,我悟了😅!纠结个毛的路径?我直接把需要的数据在NTA上还原出来不就得了,只需将EDR装在NTA上并监控文件还原的目录即可。至于我为啥选择Zeek没用Suricata,主要还是因为Zeek可定制化程度比Suricata更高一些。另外一点Zeek支持集群化部署,规则可以直接由Manager统一下发,这点要比Suricata方便很多,当然这也得益于集群的优势。
说回文件还原的事儿,Zeek上已经有 “前人” (hosom) 写过一个文件还原的模块。不过在使用中也发现了一些不太贴合我这边实际场景的情况,好在Zeek非常的“Open”😁只需要稍加改动就可以满足我的需求了。
做了哪些改进
去其糠糟,取其精华
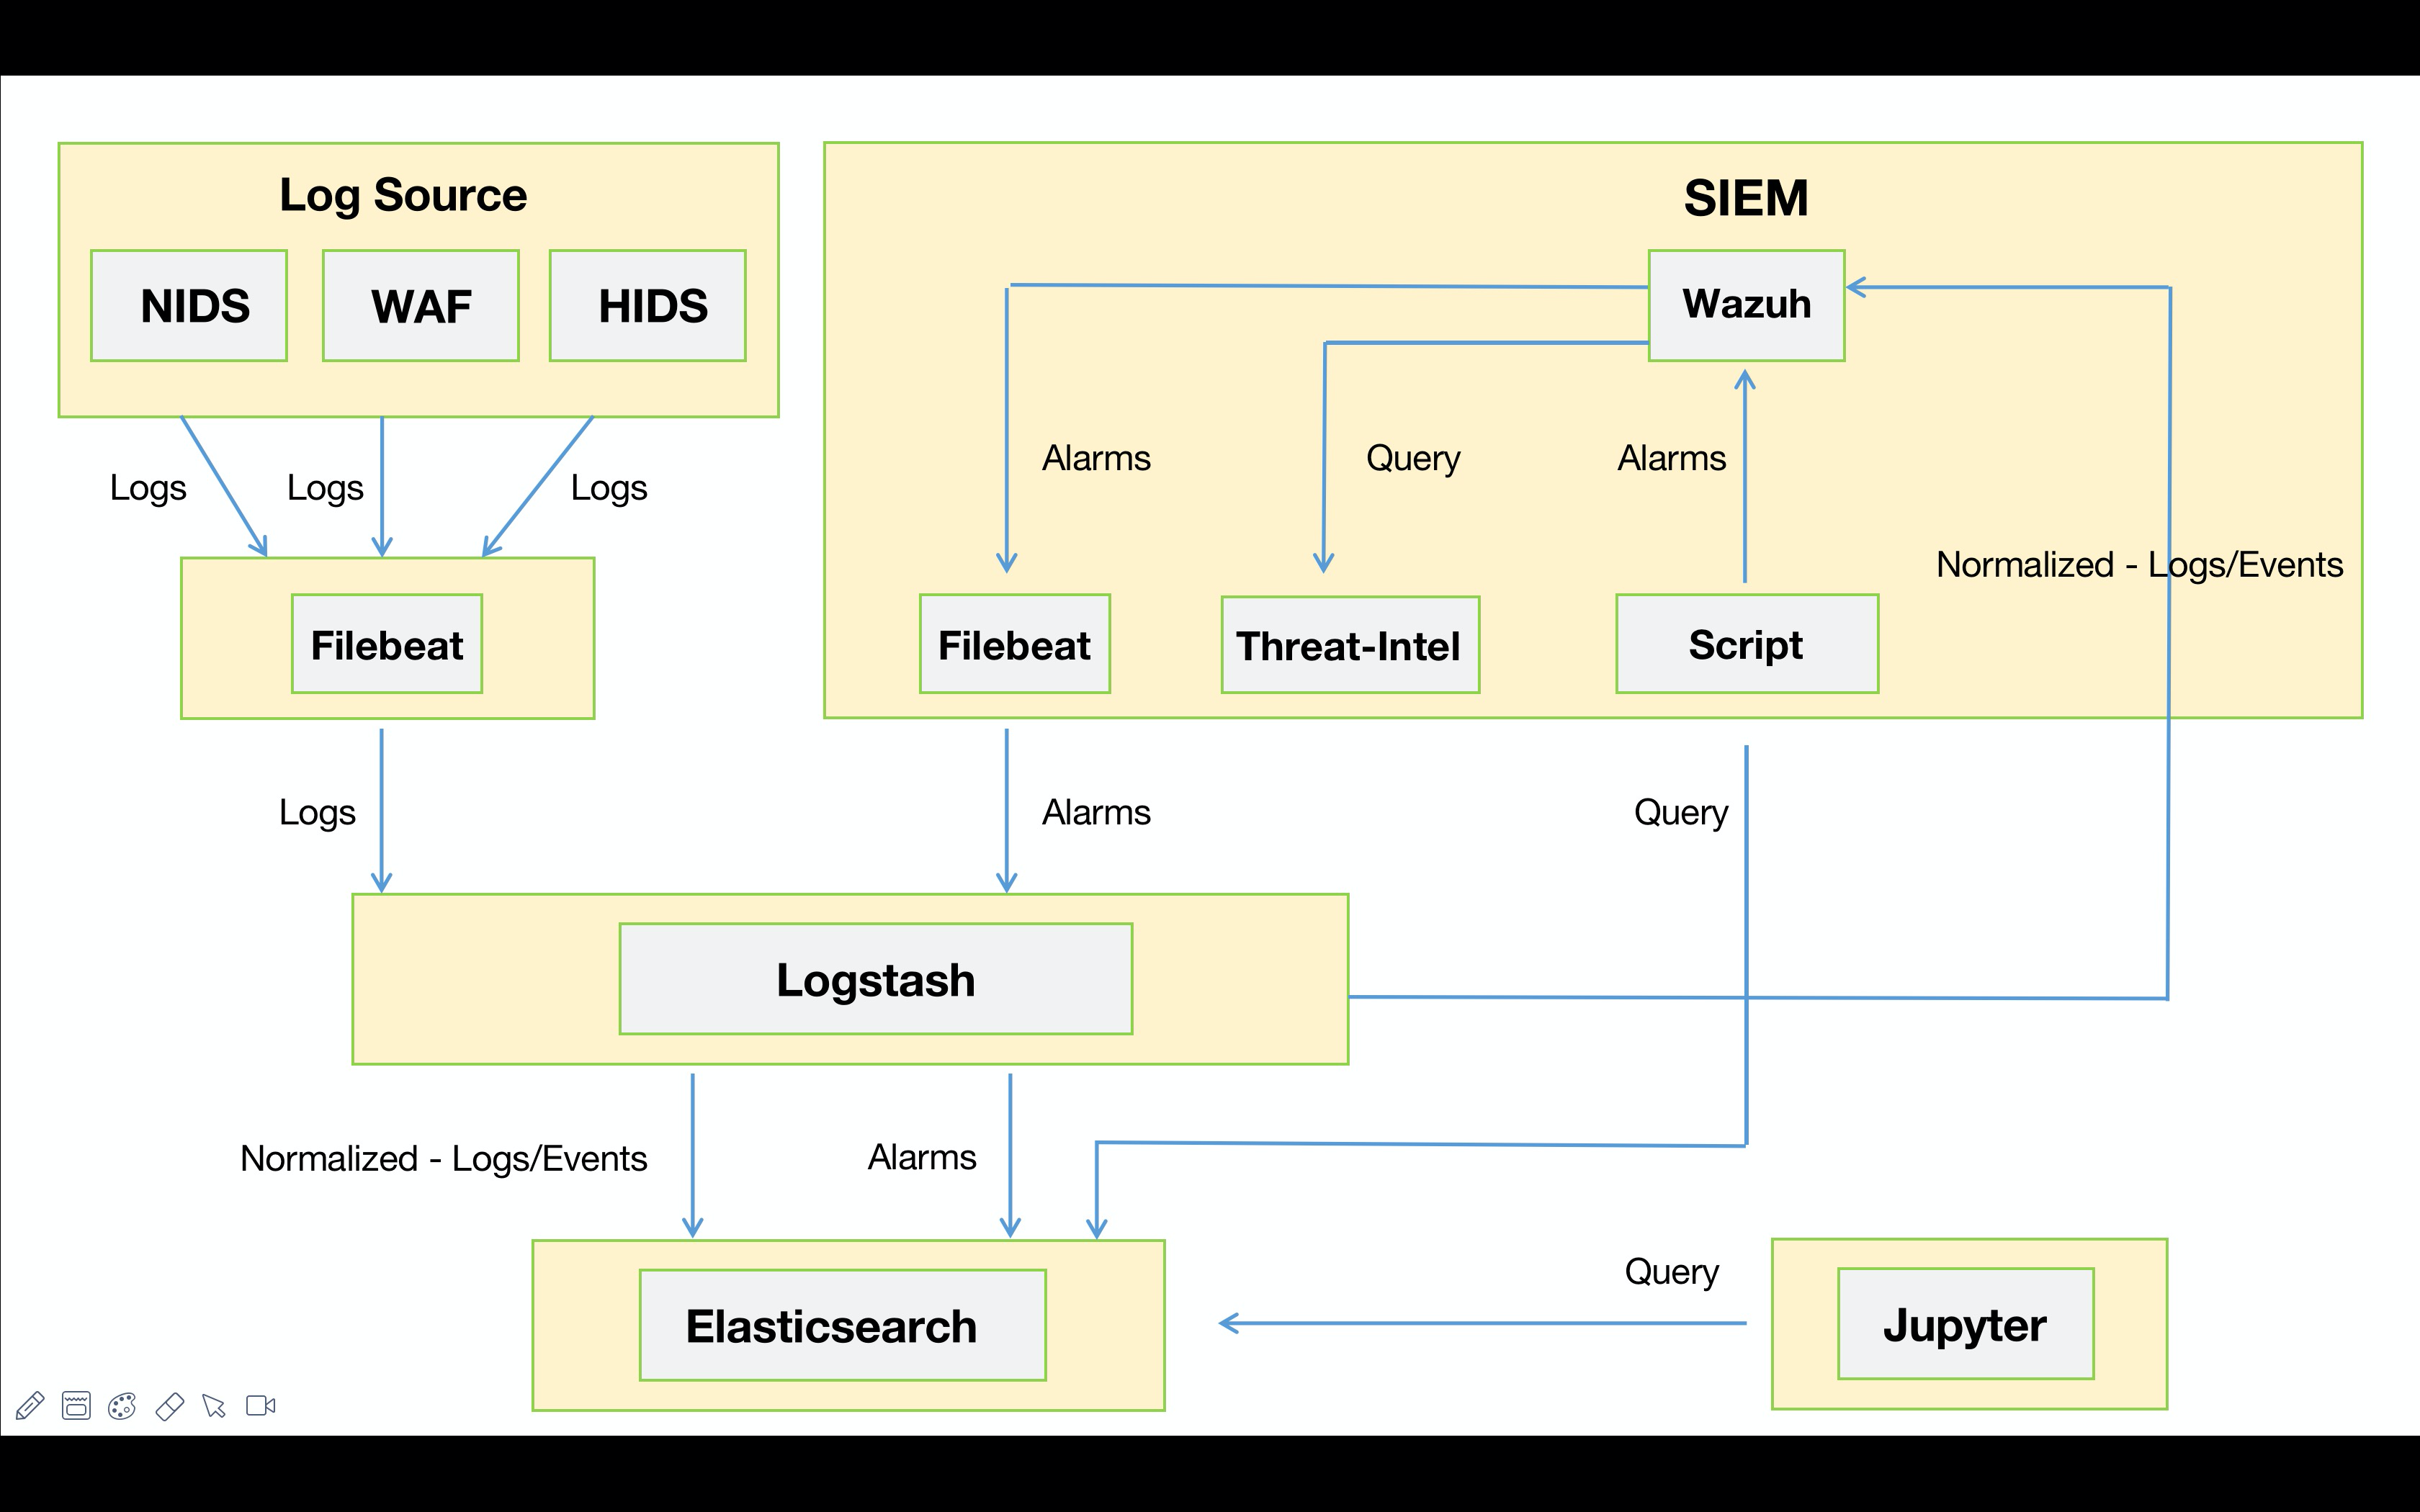
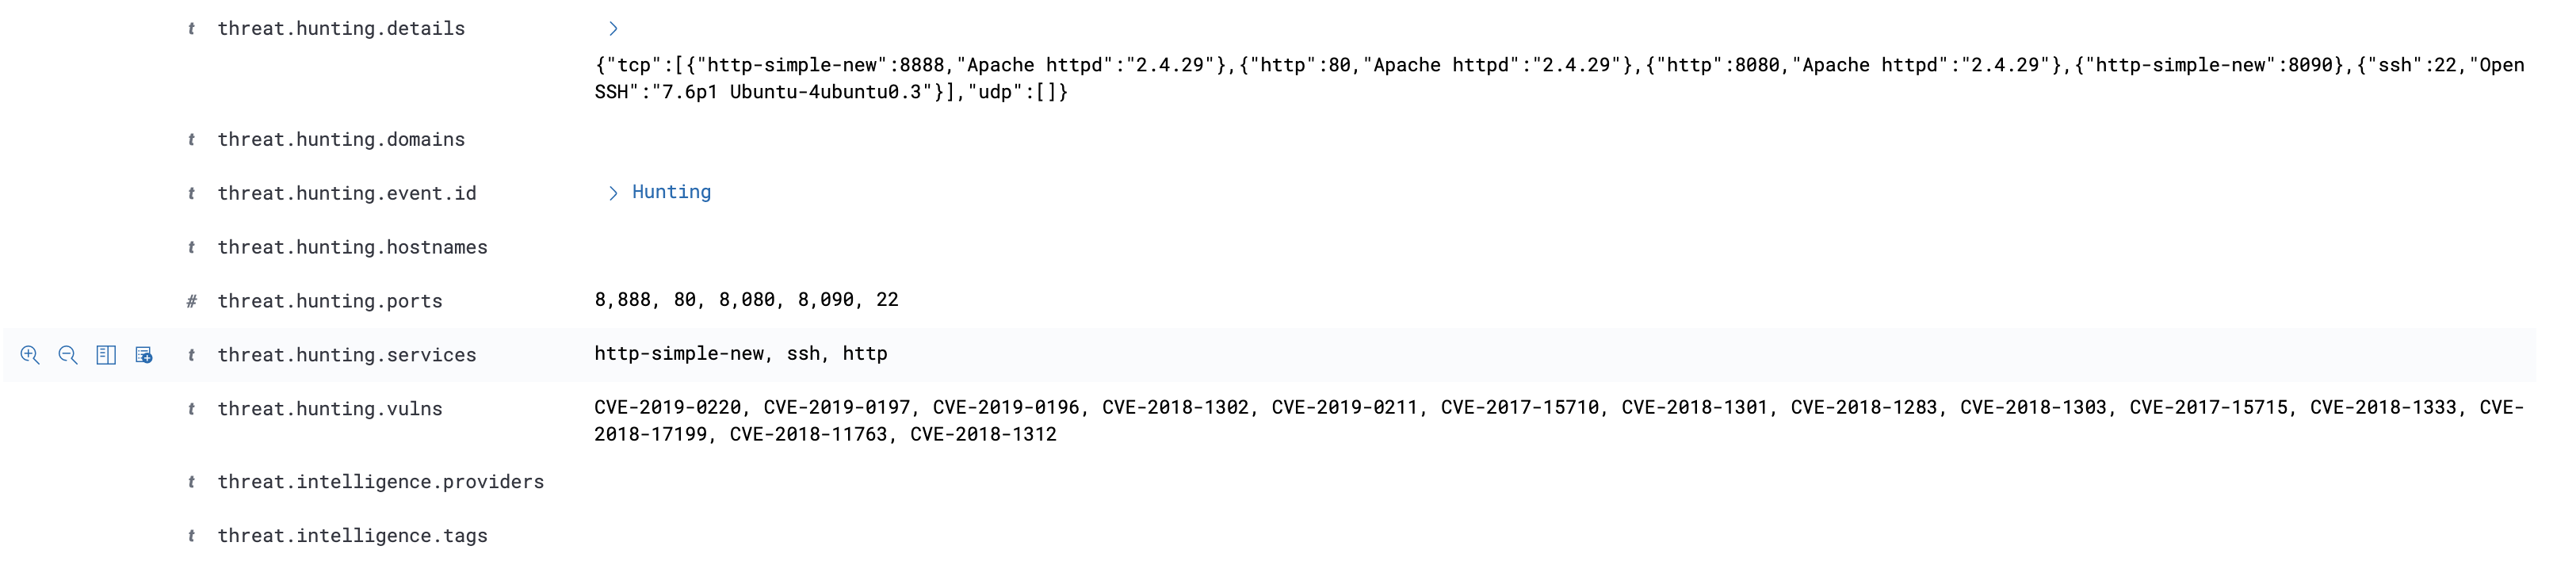
Zeek 和 Suricata 记录日志的方式比较相似,都是根据事件类型来记录日志。正因如此,若想对文件还原事件进行溯源,还需借助协议解析日志来进行上下文的关联。例如,通过HTTP协议还原的文件,就需要借助
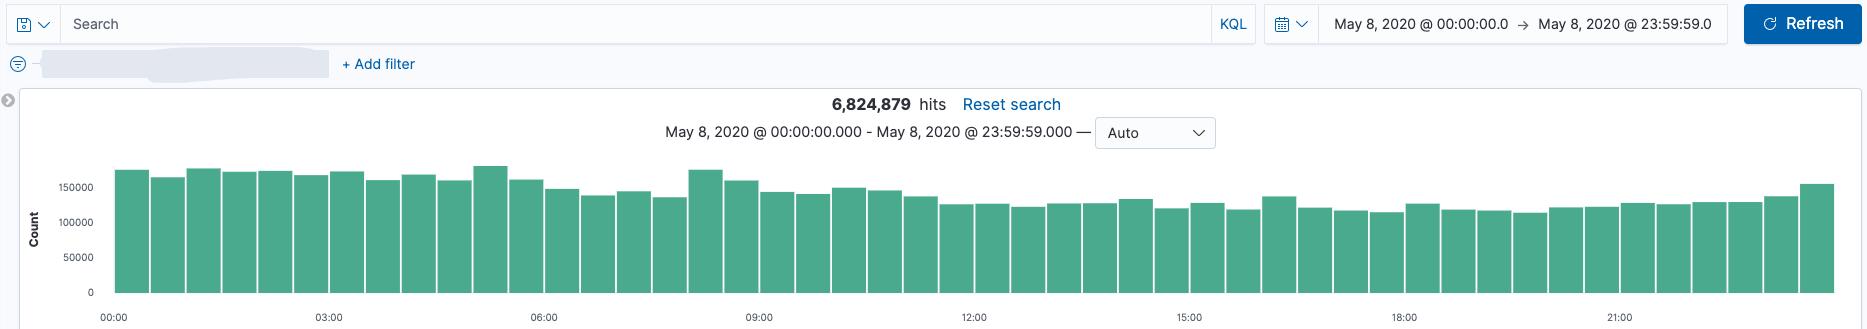
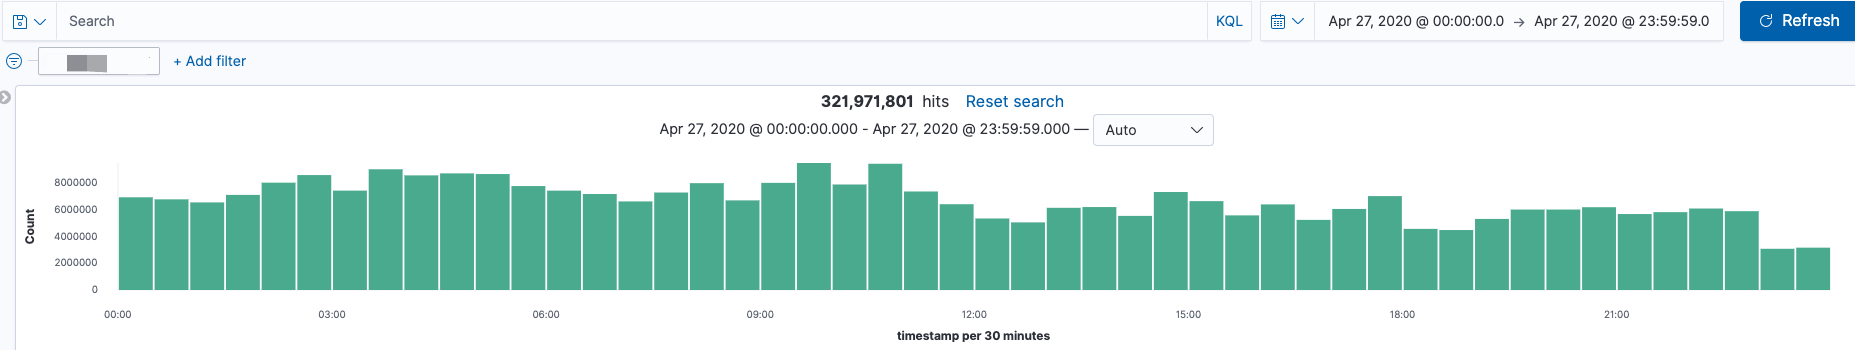
http.log。由于在我的实际环境中HTTP流量很大,如果不对协议解析的事件做过滤的话,那么输出的日志量会非常的“恐怖”。因此,我做了一些优化,现在只有当匹配到文件还原事件后,才会输出对应的协议解析事件。1
2
3
4
5
6
7
8
9
10
11
12
13
14
15
16
17
18module Enrichment;
redef record Files::Info += {
flags: string &default="";
};
hook Files::log_policy(rec: Files::Info, id: Log::ID, filter: Log::Filter)
{
if ( rec$flags == "" )
break;
}
event zeek_init()
{
Log::remove_default_filter(Files::LOG);
local filter: Log::Filter = [$name="file_extraction", $path="file-extraction"];
Log::add_filter(Files::LOG, filter);
}1
2
3
4
5
6
7
8
9
10
11
12
13
14
15
16
17
18
19
20
21
22
23
24
25
26
27
28
29
30module Enrichment;
redef record HTTP::Info += {
records: bool &default=F;
domain: string &optional &log;
};
hook HTTP::log_policy(rec: HTTP::Info, id: Log::ID, filter: Log::Filter)
{
if ( rec$records == F )
break;
}
event zeek_init()
{
Log::remove_default_filter(HTTP::LOG);
local filter: Log::Filter = [$name="http_extraction", $path="http-extraction"];
Log::add_filter(HTTP::LOG, filter);
}
export {
global http: function(f: fa_file): fa_file;
}
function http(f: fa_file): fa_file
{
f$http$records = T;
f$http$domain = f$http$host;
return f;
}示例 - 1
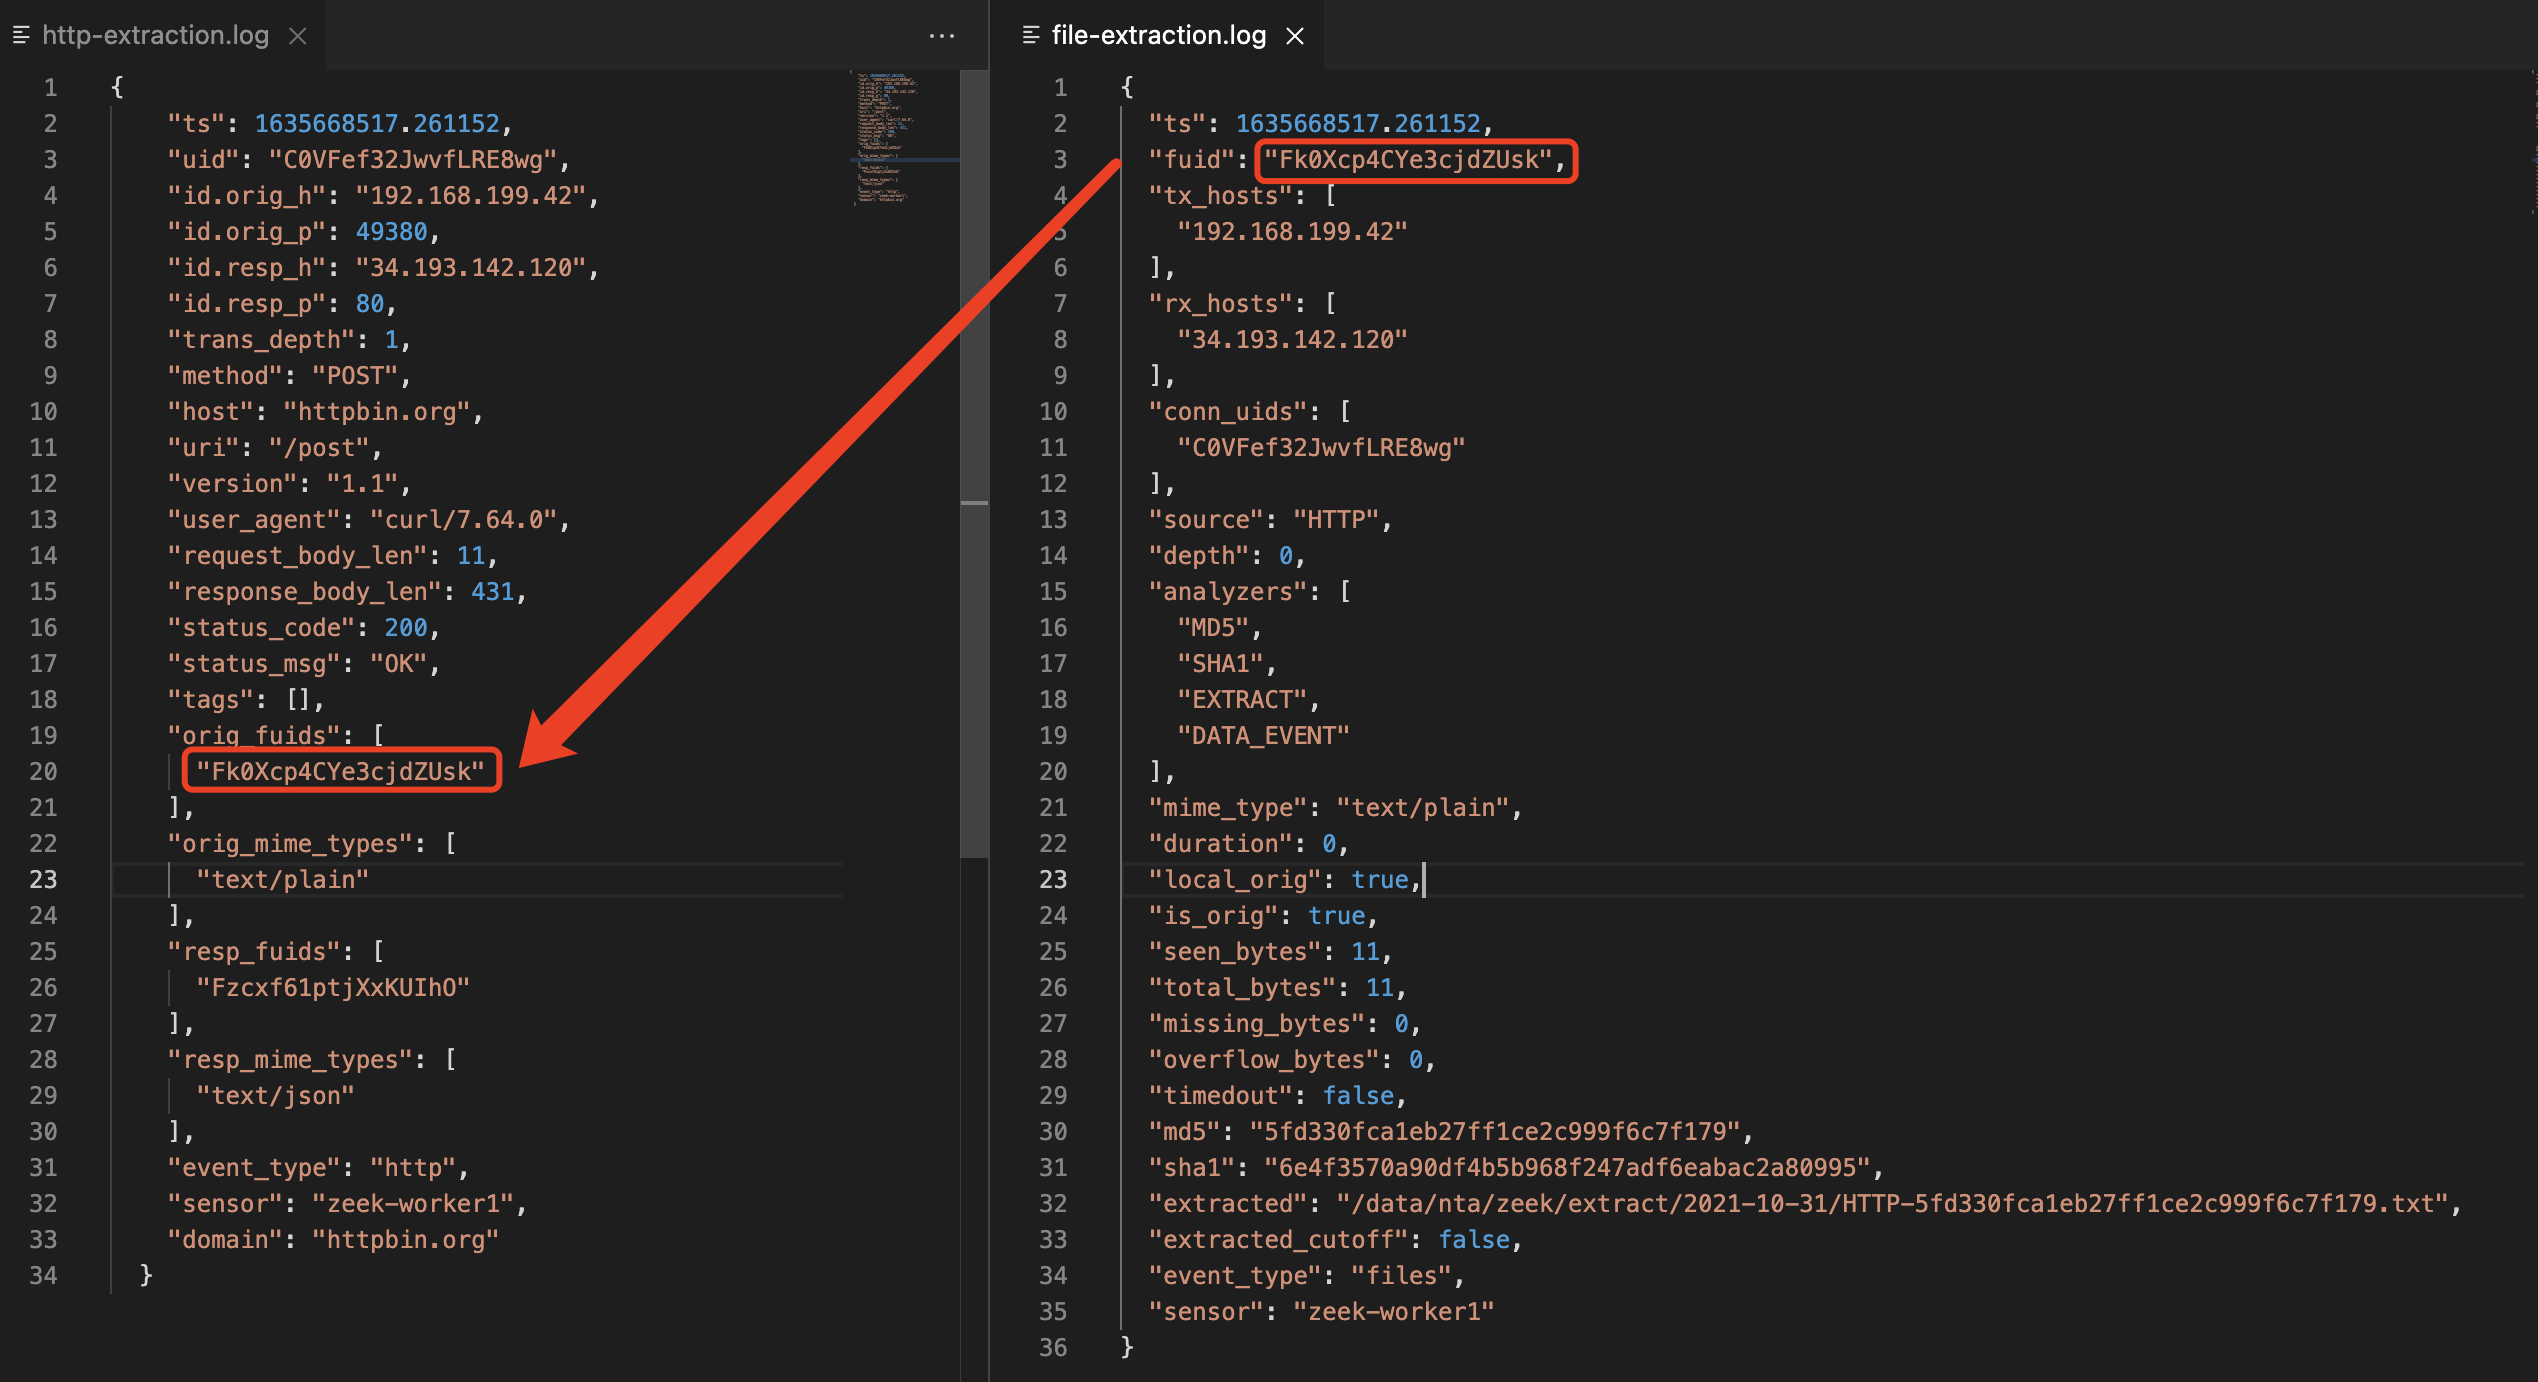
**http-extension-logs.zeek**,负责记录命中文件还原的协议解析事件,后期通过将2个事件fuid字段进行关联,可以帮助我们更好的去分析整个事件。
更灵活,更强大
支持根据文件类型选择hash或者extract
hash: 只计算文件的HASH但不对此文件进行提取;
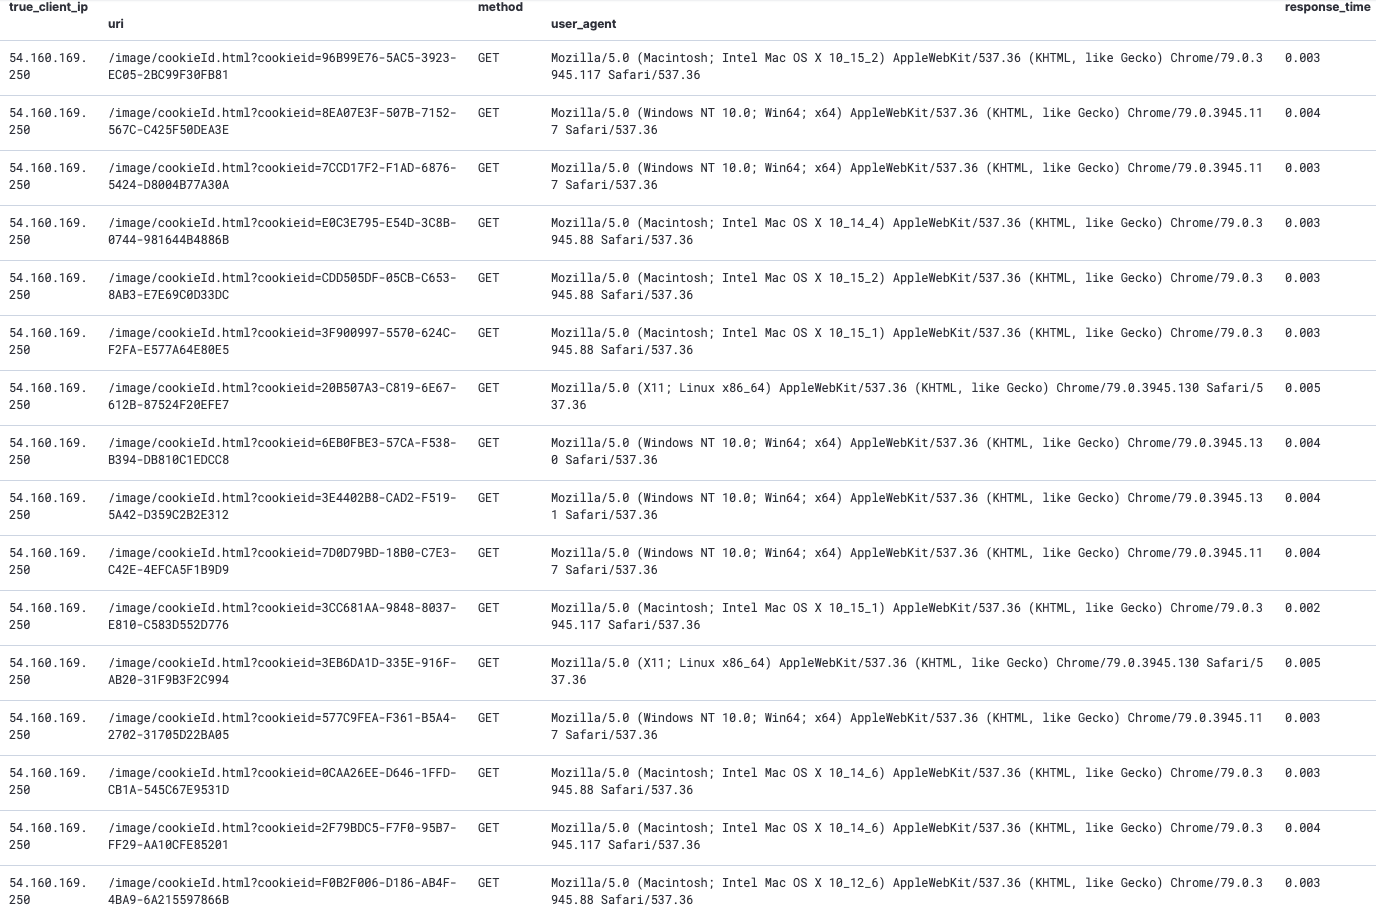
extract: 还原指定类型的文件。支持针对HTTP协议,可选域名、URI、请求方法等字段组合进行提取,文件还原后按照日期存储;
1
2
3
4
5
6
7
8
9
10
11
12
13
14
15
16
17
18
19
20
21
22
23
24
25
26
27
28
29
30
31
32
33
34
35
36
37
38
39
40
41
42
43
44
45
46@load ../__load__
module FileExtraction;
const custom_types: set[string, string] = {
["image/jpeg", "hash"],
["image/png", "hash"],
["image/gif", "hash"],
["text/x-php", "extract"],
["application/x-executable", "extract"],
["application/x-pdf", "extract"],
["application/java-archive", "extract"],
["application/x-java-applet", "extract"],
["application/x-java-jnlp-file", "extract"],
["application/msword", "extract"],
["application/vnd.openxmlformats-officedocument.wordprocessingml.document", "extract"],
["application/vnd.openxmlformats-officedocument.spreadsheetml.sheet", "extract"],
["application/vnd.openxmlformats-officedocument.presentationml.presentation", "extract"],
};
const custom_extract: set[string] = {
["POST"]
};
hook FileExtraction::extract(f: fa_file, meta: fa_metadata) &priority = 5
{
if ( [meta$mime_type, "extract"] in custom_types )
{
f$info$flags = "extract";
break;
}
if ( [meta$mime_type, "hash"] in custom_types )
{
f$info$flags = "hash";
break;
}
}
hook FileExtraction::http_extract(f: fa_file, meta: fa_metadata) &priority = 5
{
if ( f$http?$host && f$http?$method && f$http?$uri && f$info$is_orig )
if ( [f$http$method] in custom_extract )
break;
f$info$flags = "";
}1
2
3
4
5
6
7
8
9
10
11
12
13
14
15
16
17
18
19
20
21
22
23
24
25
26
27
28@load ../__load__
@load policy/frameworks/files/hash-all-files
event file_state_remove(f: fa_file)
{
if ( !f$info?$extracted || !f$info?$md5 || FileExtraction::path == "" )
return;
local orig = f$info$extracted;
local split_orig = split_string(f$info$extracted, /\./);
local extension = split_orig[|split_orig|-1];
# 按照日期进行文件的还原存储
local ntime = fmt("%D", network_time());
local ndate = sub_bytes(ntime, 1, 10);
local dest_dir = fmt("%s%s", FileExtraction::path, ndate);
mkdir(dest_dir);
local dest = fmt("%s/%s-%s.%s", dest_dir, f$source, f$info$md5, extension);
local cmd = fmt("mv %s %s", orig, dest);
when ( local result = Exec::run([$cmd=cmd]) )
{
}
if ( rename(orig, dest) )
f$info$extracted = dest;
}
示例 - 2
- Zeek - Files
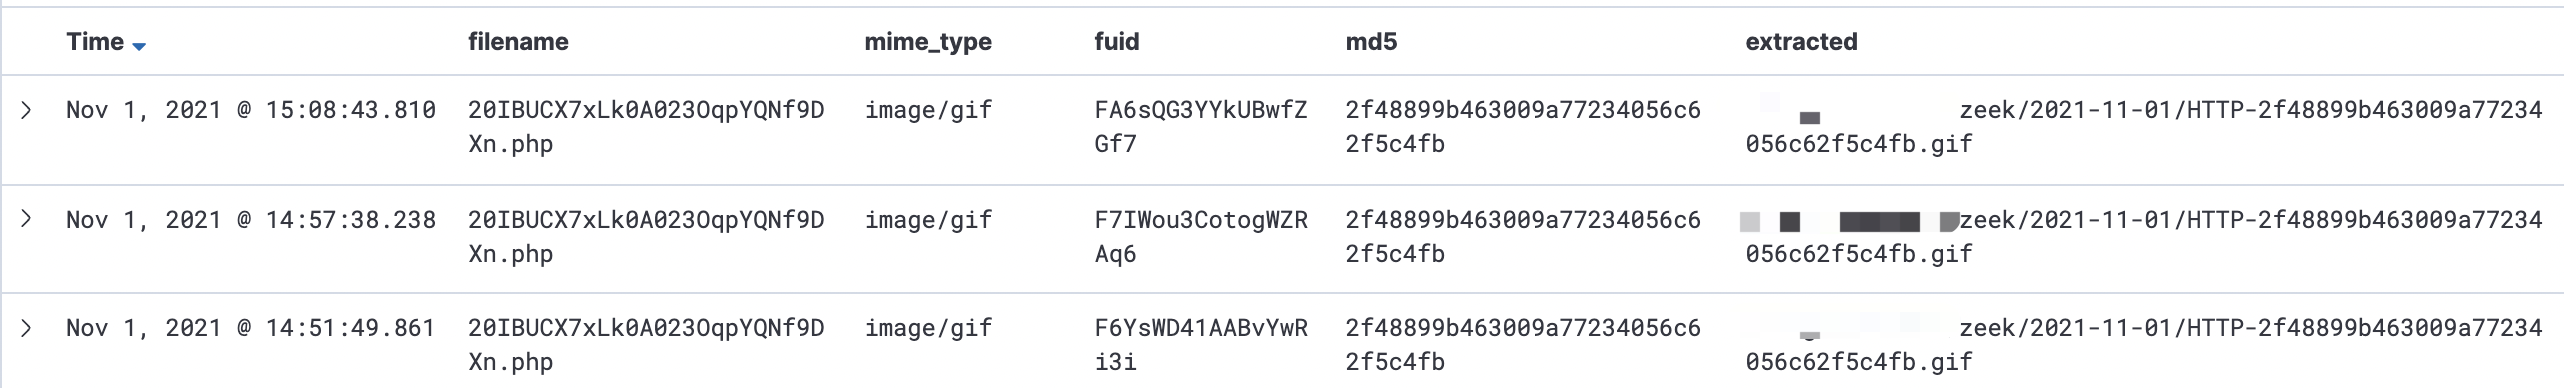
- Zeek - HTTP
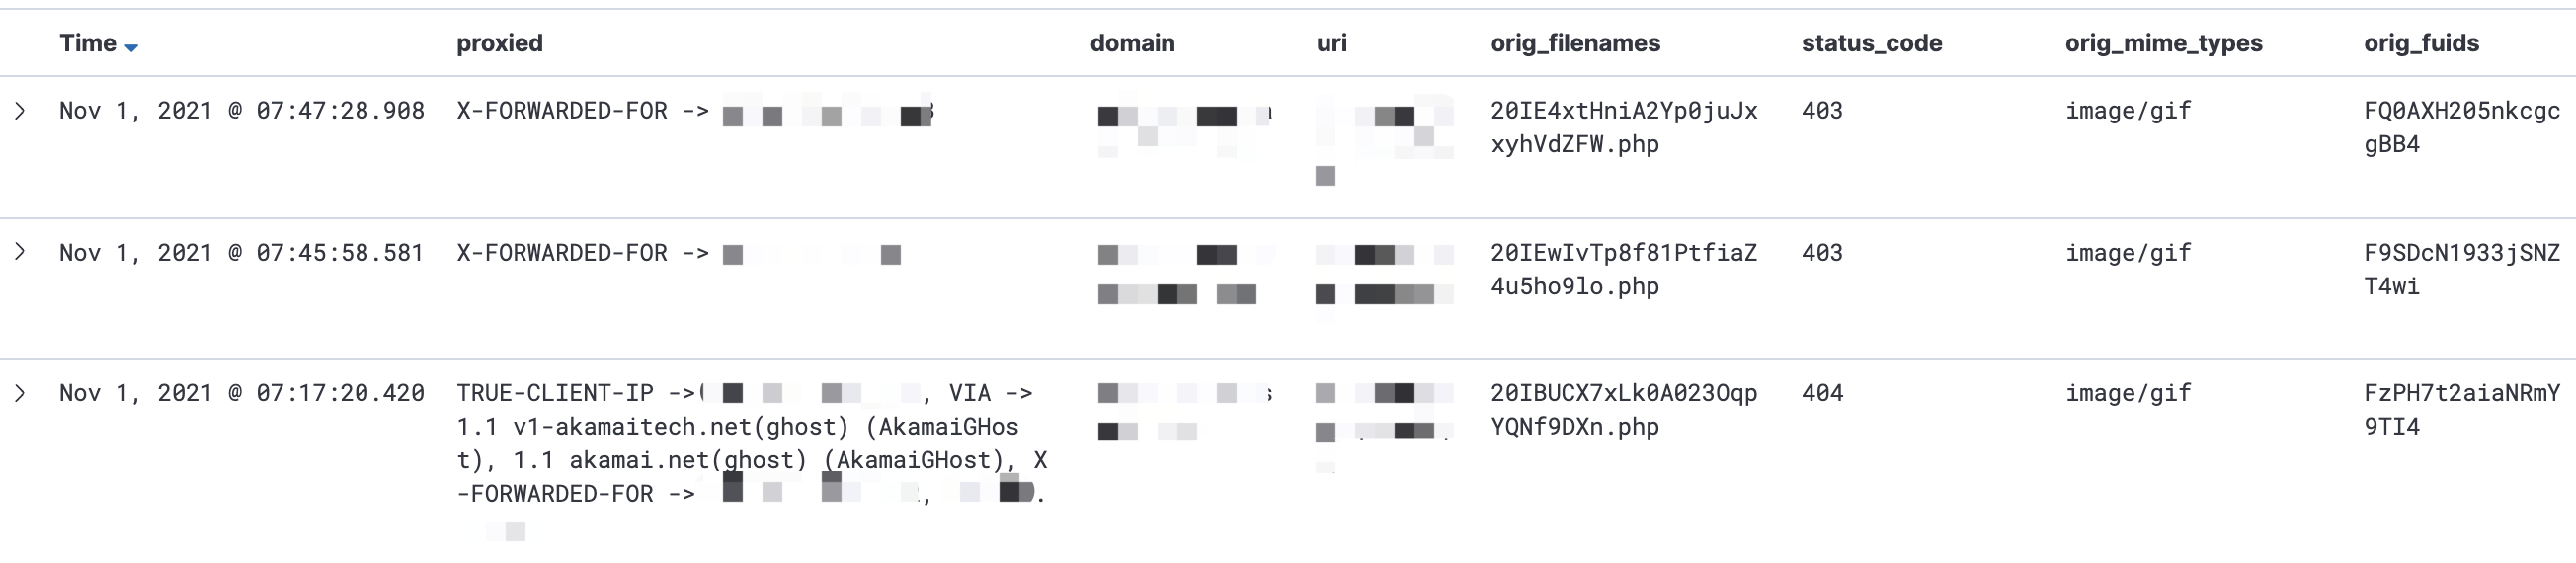
1 | $ more ./zeek/2021-11-01/HTTP-2f48899b463009a77234056c62f5c4fb.gif |
示例 - 3
- Zeek - Files
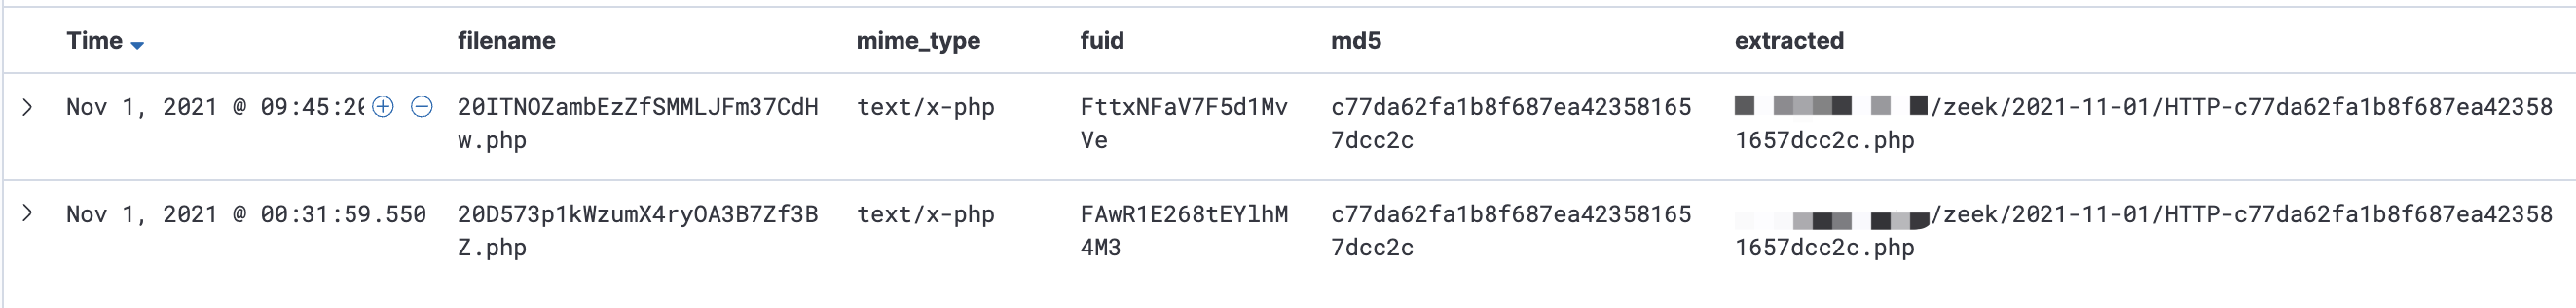
- Zeek - HTTP
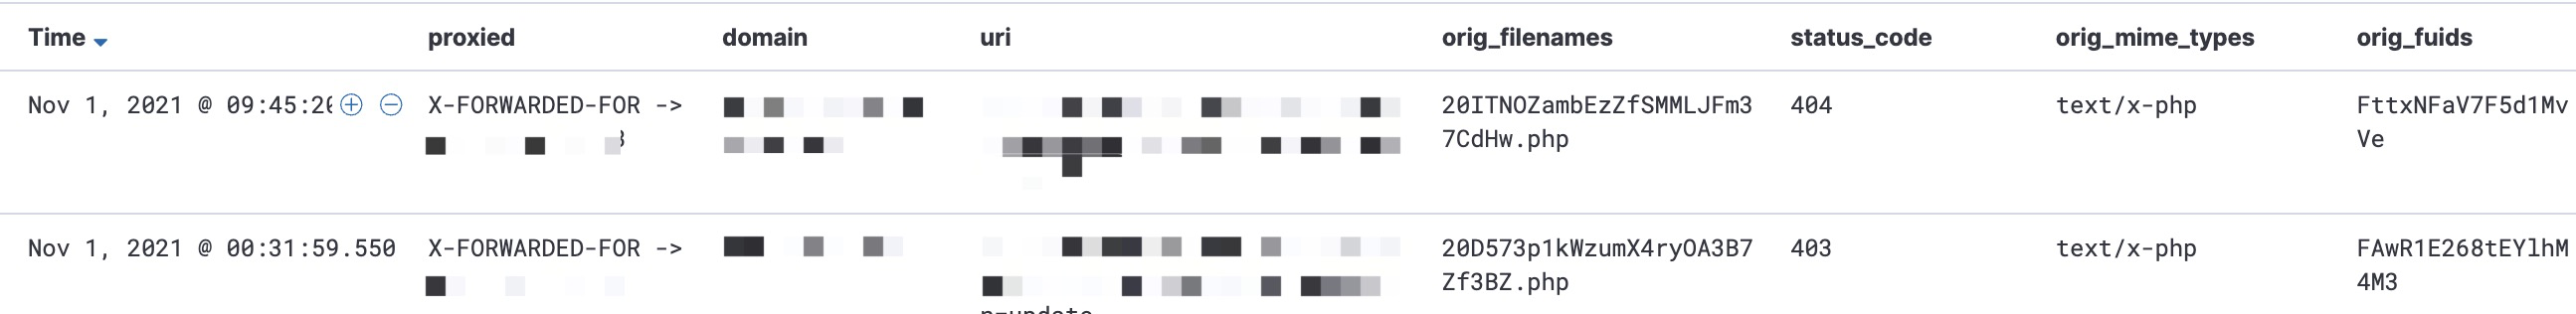
1 | $ more ./zeek/2021-11-01/HTTP-c77da62fa1b8f687ea423581657dcc2c.php |
小提示:
当启用文件提取时,记得调整Zeek的这个配置,指定最大提取数据大小,否则会出现提取被截段的现象。
- file-extract_limit.zeek
1 | redef FileExtract::default_limit = 5000000000; |


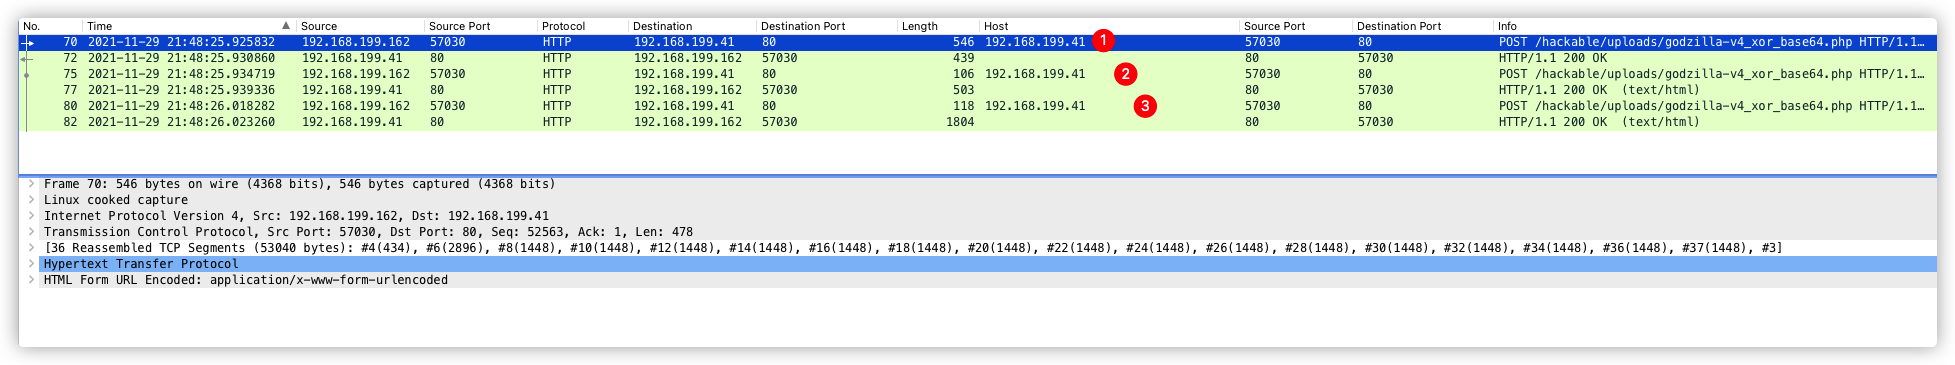
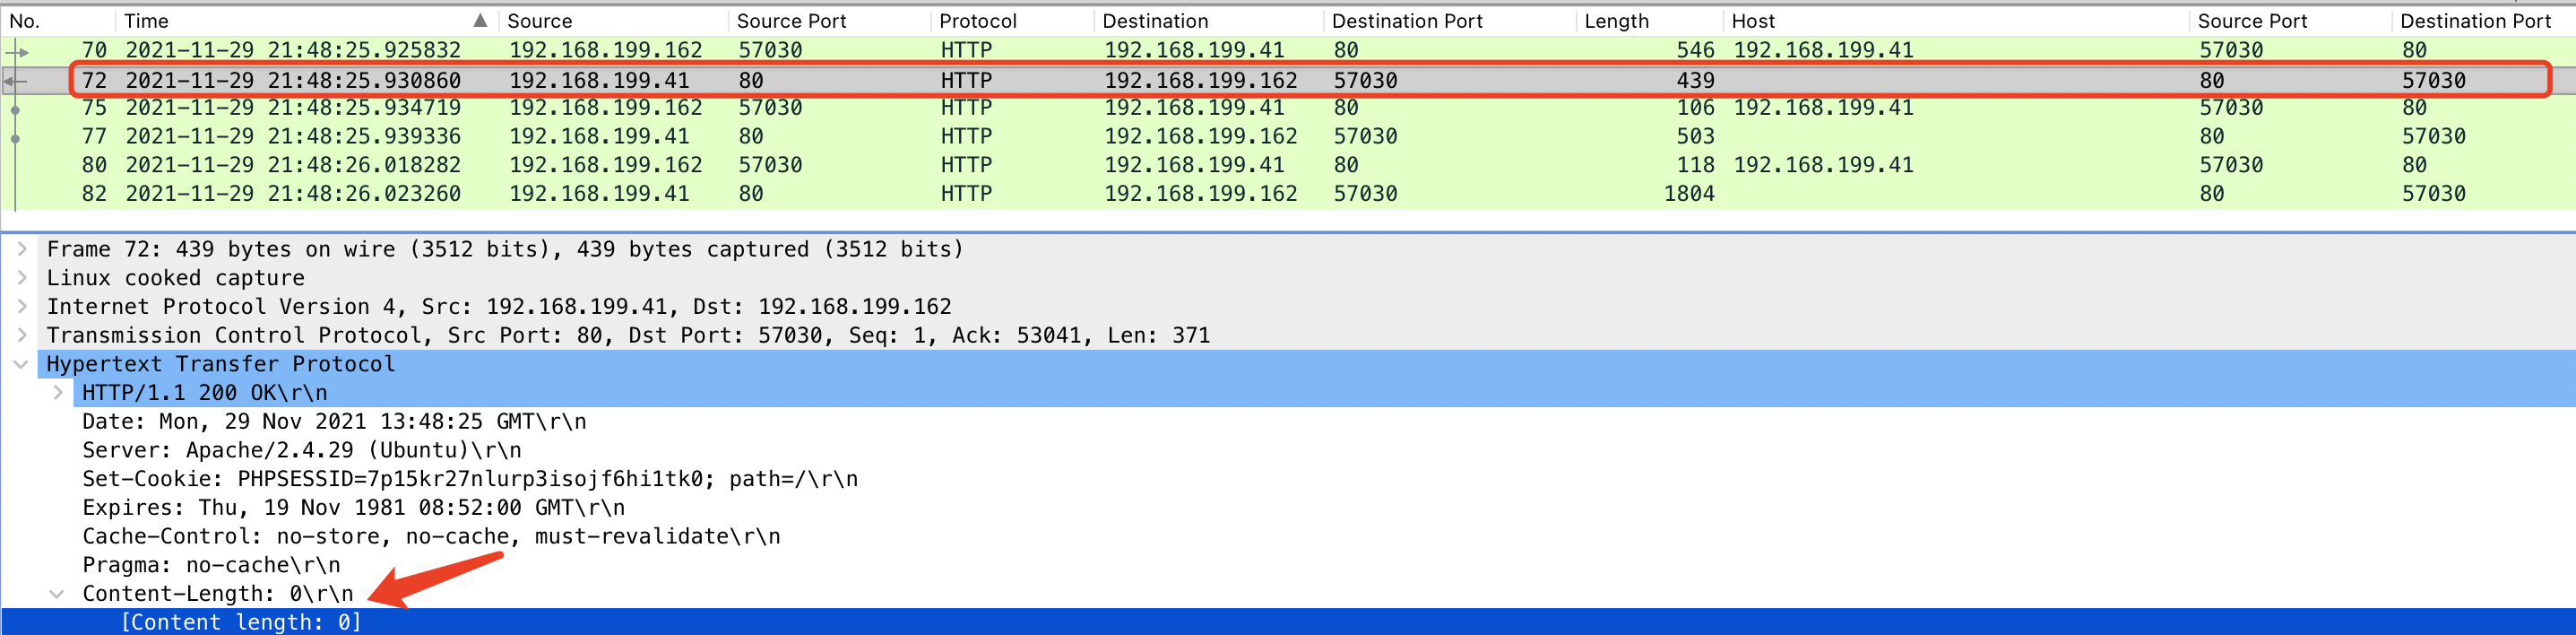
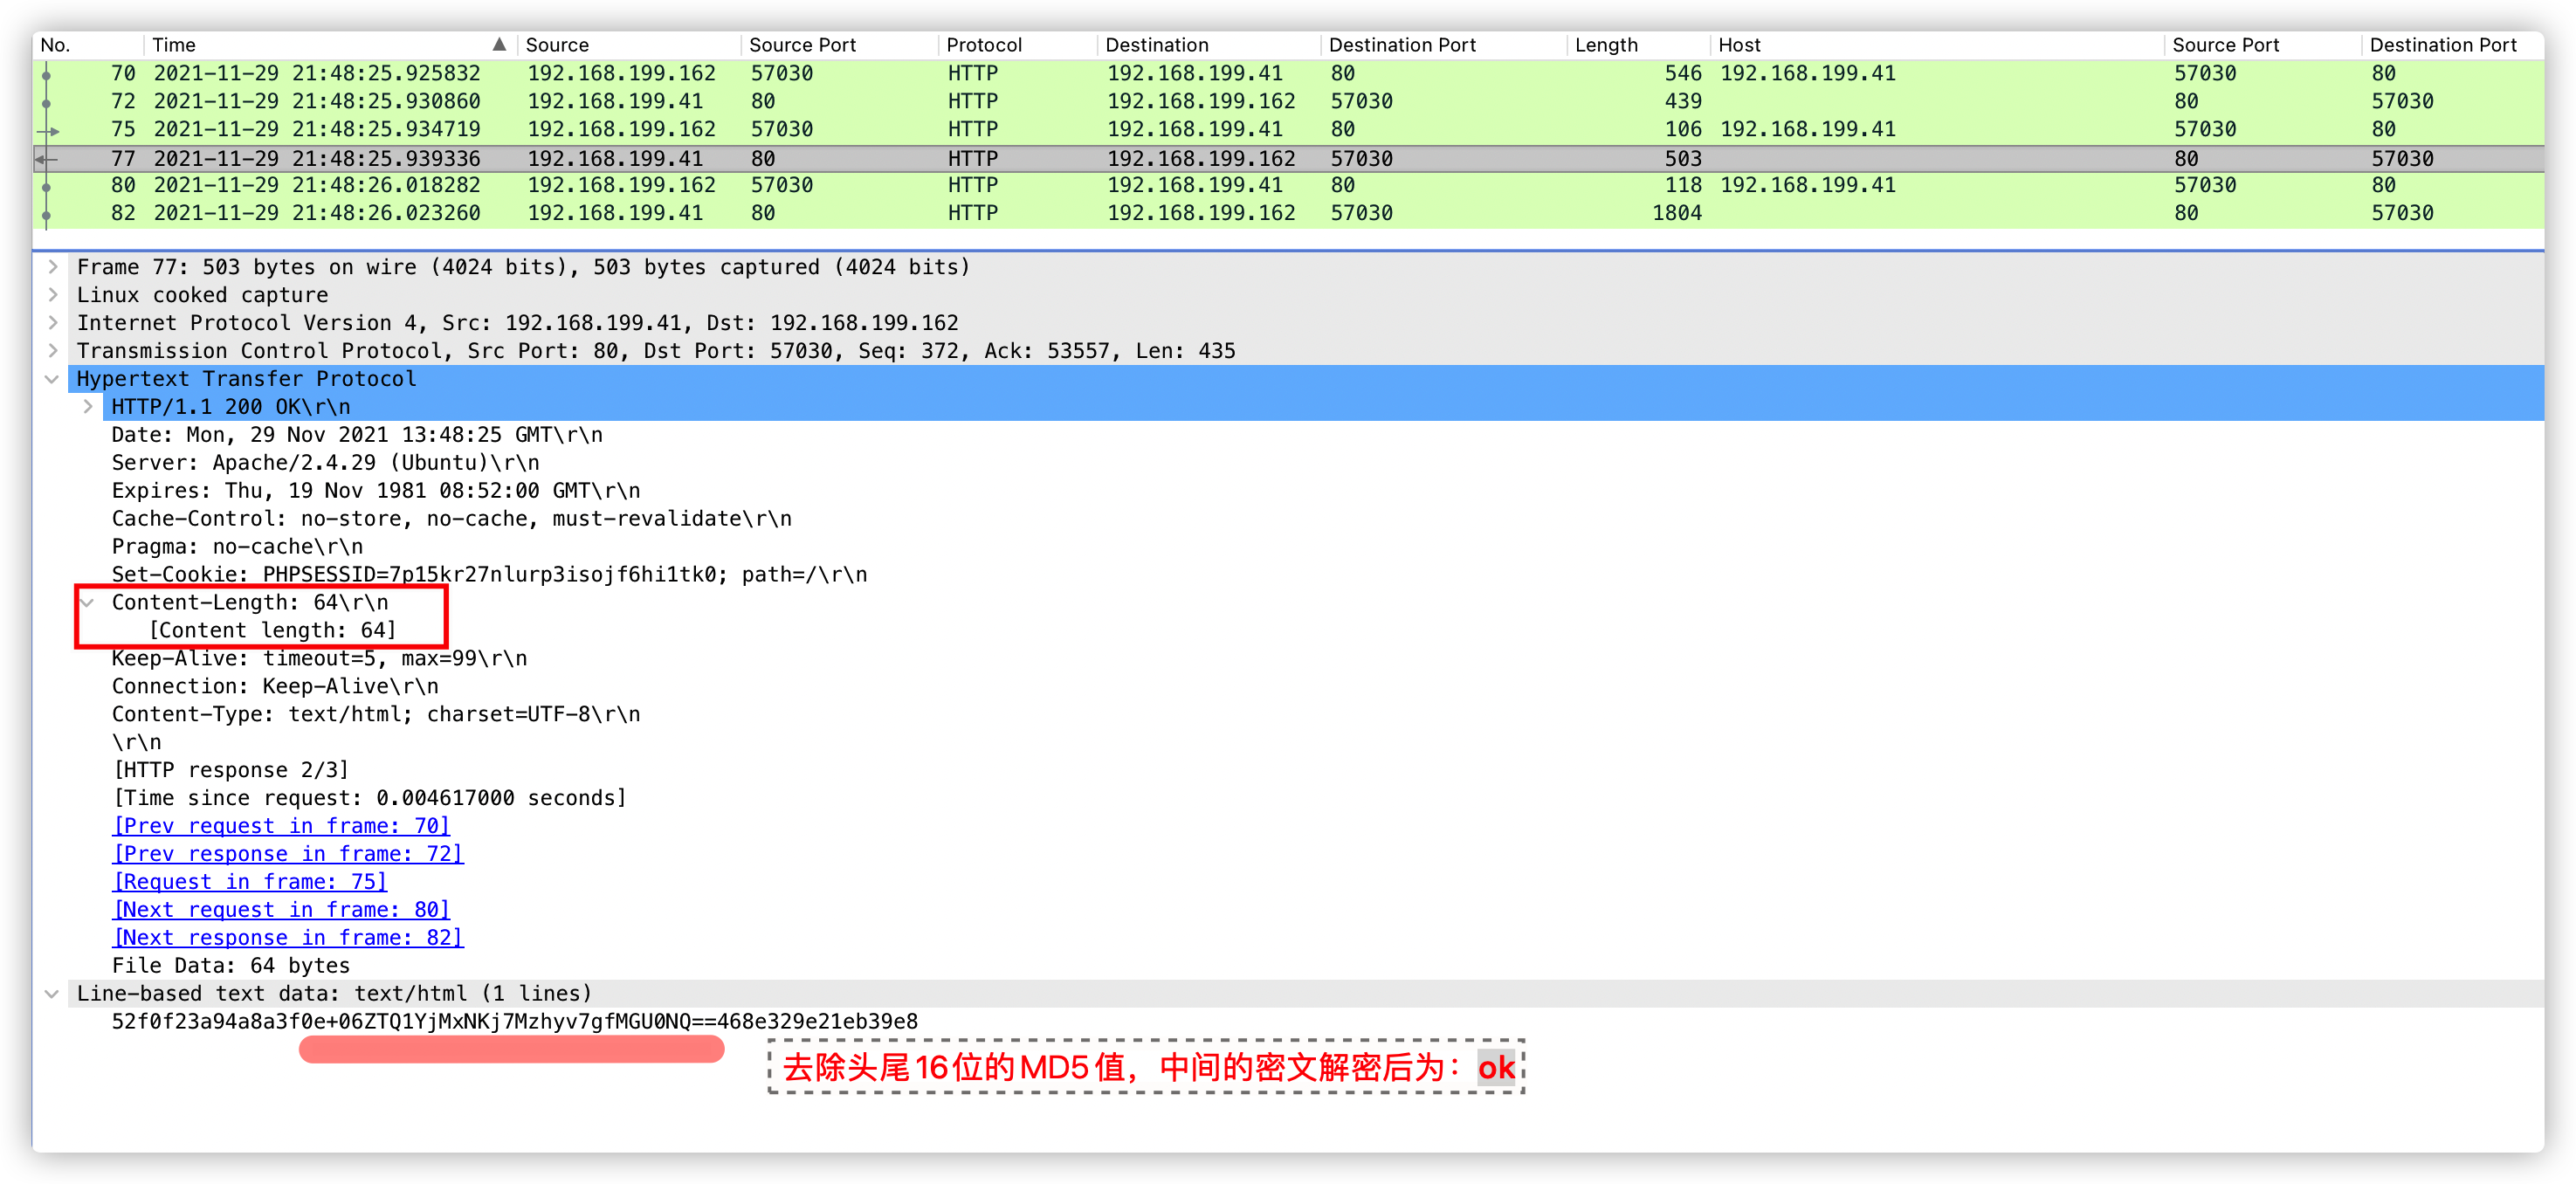
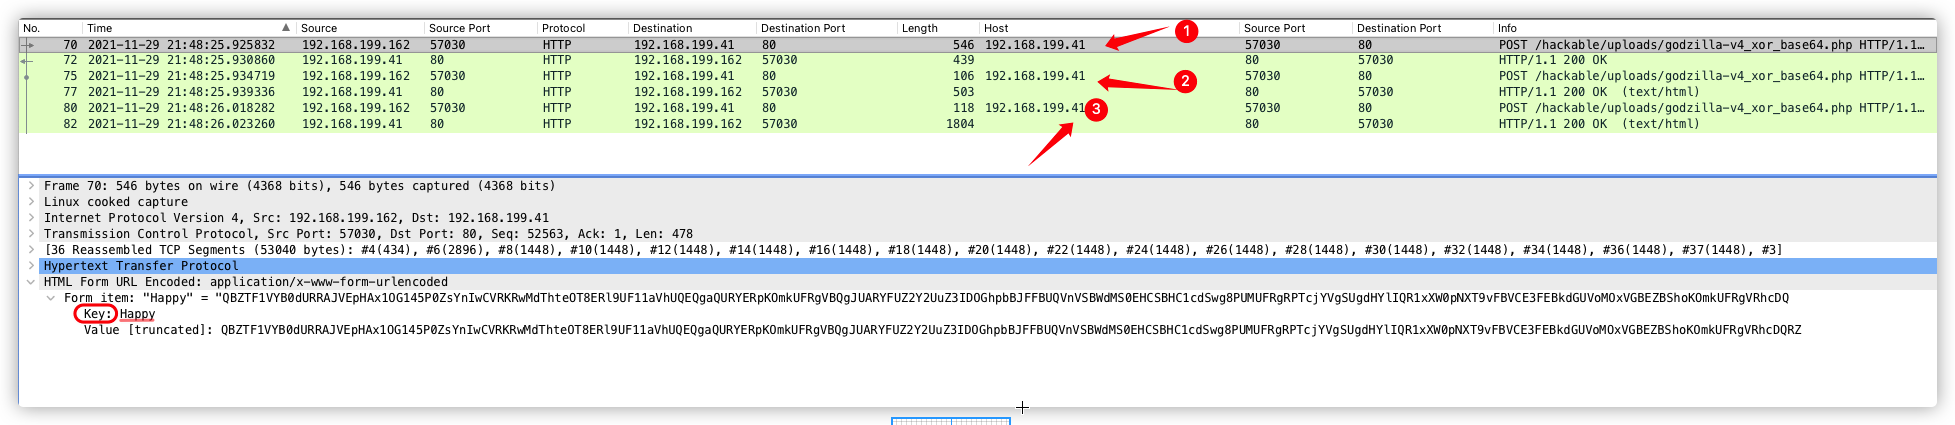
 注:第三次响应数据包,不可作为特征提取。因为每个服务器的基础信息不一样,所以返回内容长度也不一样。